By: Erica Horn, CPA, JD | ehorn@deandorton.com and Maddie Schueler, JD, LLM | mschueler@deandorton.com
State governments provide services largely by using taxes paid by their residents and others doing business in the state. It is no secret that Kentucky has borders with seven states: Indiana, Illinois, Missouri, Ohio, Tennessee, Virginia, and West Virginia. The borders with Indiana and Tennessee have the greatest impact on the state’s tax policy, but Ohio and West Virginia also play a role. Therefore, it is interesting to compare Kentucky’s sources of state tax receipts to those of Indiana, Tennessee, Ohio, and West Virginia.1 Here is what we found.
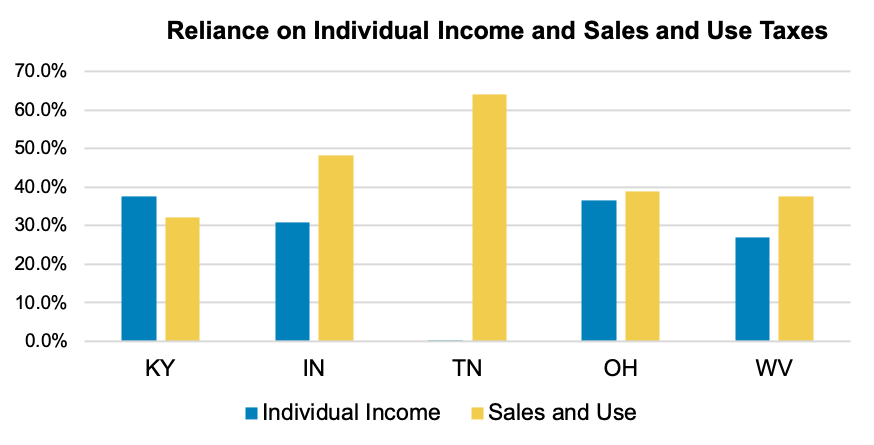
Except Kentucky, the states rely most heavily on sales and use taxes, followed by individual income taxes. For example, because Tennessee has no individual income tax, 64.0% of its state tax receipts are from sales and use taxes. By contrast, only 32.2% of Kentucky’s total receipts are from sales and use taxes, while 37.7% are from individual income taxes. Here is a comparison of the percentage of gross receipts by state for sales and use and individual income taxes.
https://deandorton.com/wp-content/uploads/2021/06/Reliance-on-Individual-Income-and-Sales-and-Use-Taxes-600×305.png
The role of taxes on business, whether based on income, gross receipts, or another measure, is less than 7.5% in all states except for Tennessee.[2] Business taxes comprise 19.7% of Tennessee’s total tax receipts. By comparison, the business tax receipt percentages for the other states are Kentucky— 5.1%, Indiana— 4.4%, Ohio— 7.4%, and West Virginia— 5.6%.
Transportation taxes, such as motor and special fuels, motor vehicle licensing fees, and similar charges make up at least 9.0% of total state tax receipts. West Virginia leads the way with transportation taxes equal to 16.5% of its total gross receipts. By contrast, Ohio’s and Indiana’s are 9.1% and 9.4%, while Tennessee’s and Kentucky’s are 10.3% and 11.6%.
Tobacco and alcohol taxes are less than 5% of total state tax receipts in each state. The highest percentages are in West Virginia and Kentucky, which come in at 4.8% and 4.2%. The other three states range between 2.7% and 3.4%.
Three additional observations relate to property, natural resources, and gaming taxes. First, the only state with state property tax receipts over 1.0% is Kentucky, where state property taxes were 5.1% of total state tax receipts. Second, West Virginia’s gross receipts from taxes on natural resources were 5.2% of its total, while Kentucky’s was 0.7%. Finally, Indiana had the greatest percent of gross receipts from gaming, with a total of 2.5%.
https://deandorton.com/wp-content/uploads/2021/06/Tax-Type-as-a-Percent-of-Total-State-Tax-Receipts.png
On a final note, here is a look at the raw dollars by tax type and a breakdown of the total state tax receipts on a per capita basis.3
| Tax Type | KY | IN | TN | OH | WV |
|---|---|---|---|---|---|
| Individual Income | $4,765,235,522 | $5,271,814,147 | $57,641,855 | $10,349,317,882 | $1,386,571,000 |
| Sales and Use | $4,070,905,629 | $8,234,288,437 | $9,656,615,553 | $11,018,498,537 | $1,947,946,000 |
| Business | $639,305,779 | $756,865,803 | $2,978,925,918 | $2,106,257,278 | $290,031,000 |
| Tobacco and Alcohol | $536,316,748 | $462,143,513 | $452,301,117 | $970,428,864 | $246,501,000 |
| Transportation | $1,460,330,063 | $1,610,918,000 | $1,559,612,993 | $2,587,643,289 | $852,000,000 |
| Other | $1,168,354,882 | $719,224,900 | $393,900,663 | $1,319,692,416 | $439,480,000 |
| Total Tax Receipts | $12,640,448623 | $17,055,254,800 | $15,098,998,099 | $28,351,838,266 | $5,162,529,000 |
| Population | 4,505,800 | 6,785,500 | 6,910,840 | 11,799,400 | 1,793,700 |
| Per capita | $2,805 | $2,513 | $2,185 | $2,403 | $2,878 |
1 Our comparisons were made using data from the budget offices and departments of revenue of the states for their fiscal years ended June 30, 2020. We excluded local tax receipts and non-tax sources of revenue, such as state lotteries.
2 Note that most closely-held businesses operate in pass-through entities; in these cases, individual owners normally are taxed on business profits, and those taxes are included in individual income taxes paid.
3 Data source: Census Apportionment Results
This article was originally published in News & Views (Dean Dorton’s quarterly newsletter).