By: Jon Tennent, CPA | jtennent@deandorton.com
We have assembled four graphs below to visualize certain state financial data collected and published by the US Census Bureau. In each case, the data are drawn from the most recent source available.
1. The graph below shows total expenditures per capita according to published state financials for fiscal years ending in 2018. The amounts go from about $4,500 to $11,200—a broad range. The data show that Kentucky has the fifteenth highest amount.
https://deandorton.com/wp-content/uploads/2020/11/2018-Total-Expenditures-per-Capita-by-State-1200×507.png
Source for expenditures: https://www.census.gov/data/tables/2018/econ/state/historical-tables.html
Source for population: https://www.census.gov/data/tables/time-series/demo/popest/2010s-state-total.html
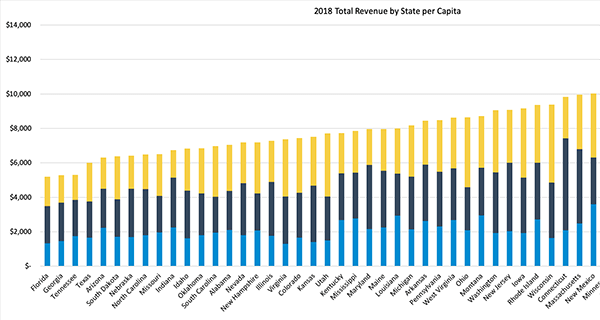
2. The graph below shows total revenue per capita according to published state financials for fiscal years ending in 2018. Kentucky ranks near the middle as the 22nd lowest.
https://deandorton.com/wp-content/uploads/2020/11/2018-Total-Revenue-by-State-per-Capita-1200×518.png
Source for expenditures: https://www.census.gov/data/tables/2018/econ/state/historical-tables.html
Source for population: https://www.census.gov/data/tables/time-series/demo/popest/2010s-state-total.html
3. This graph breaks out only the “Taxes” portion of graph #2 and updates it with more recent data available from 2019. It shows tax collections per capita in 2019 by state as reported by the US Census Bureau. The colors in each bar represent different types of tax collected: income, license, property, sales, and other. The per capita amounts range from about $2,000 to $6,500, and Kentucky is in the bottom half, having the 18th lowest amount.
https://deandorton.com/wp-content/uploads/2020/11/2019-Collections-by-State-per-Capita_colored-by-source-1200×438.png
Source for collections: https://www.census.gov/data/tables/2019/econ/stc/2019-annual.html
Source for population: https://www.census.gov/data/tables/time-series/demo/popest/2010s-state-total.html
4. State revenue is composed not only of taxes and collections but also of Federal grants and intergovernmental transfers. The graph below shows intergovernmental revenue as a percentage of total revenue, based on the same information from chart #2. The percentages range from 17% to 37%. As shown on the graph, Kentucky has the fifth highest percentage.
https://deandorton.com/wp-content/uploads/2020/11/2018-Intergovernmental-Revenue-as-a-Percentage-of-Revenue-by-State-1200×479.png
Source: https://www.census.gov/data/tables/2018/econ/state/historical-tables.html
This article was originally published in News & Views (Dean Dorton’s quarterly newsletter).