
Revenue and expense allocation is a giant undertaking for many organizations – but without it, your financials are only telling their users a fraction of the story. Think about the different shared costs you might have in your own organization – things like corporate or administrative team members, consultants that work for various segments, or usage-based charges for shared office equipment. What about costs such as benefits expenses or credit card processing fees? Sure, you can classify all these types of expenses as simply “overhead” and leave them in their own isolated area of a financial report, but do so and you will be depriving yourself of insights into the true cost and profitability of a given department, project, etc.
For instance, without this information, how do you determine in an objective, indisputable manner that a segment of your organization is draining excessive time (and therefore cost) from your corporate team, which in turn limits that team’s ability to focus on your organization’s revenue growth?
The Cumbersome Process of Manual Allocations
Accounting and finance team members commonly spend anywhere from at least 2-5 days of work effort per month tirelessly formulating these allocations and turning them into actionable reporting to give management insight into how segments of the organization are really performing. These team members probably follow a process that looks something like this:
- Figure out a way to extract and format the financial data so it is aggregated at the appropriate level
- Determine which portions of the financial data need to be allocated
- Determine what the methodology is for allocating financial data
- Find the data that informs how amounts will be allocated and figure out how to aggregate that data at the appropriate level
- Engineer some kind of financial model in Excel, Google Sheets, etc. at some varying level of sophistication depending on the user’s proficiency to do some portion of the allocation calculation
- Export the financial statements from the system of record to Excel, Google Sheets, etc.
- Use formulas to factor in the allocated revenues/expenses and reflect true financial performance
- Distribute this new financial report that was generated outside the accounting system to the statement users
- Spend hours meeting and debating why the allocations were done the way they were and having to prove that the methodology is the same as it’s always been
- Re-do substantially all of the above steps when a fellow team member posts any type of transaction in the accounting system
- Accept the fact that most if not all of this work is rendered useless next month when they have to do it all over again because they will be working with all new data
- Grow tired and frustrated with this thankless process and navigate to LinkedIn to find new career opportunities
All this work contributes to a longer reporting cycle. Your month-end close may already be a week or two before you even get to allocations. Then you have to layer all this allocation work on top of it. Skip it and leave yourself in the dark as to how your segments, departments, projects – whatever your terms may be – are truly performing.
If you skip allocations, your Income Statement might look something like this:
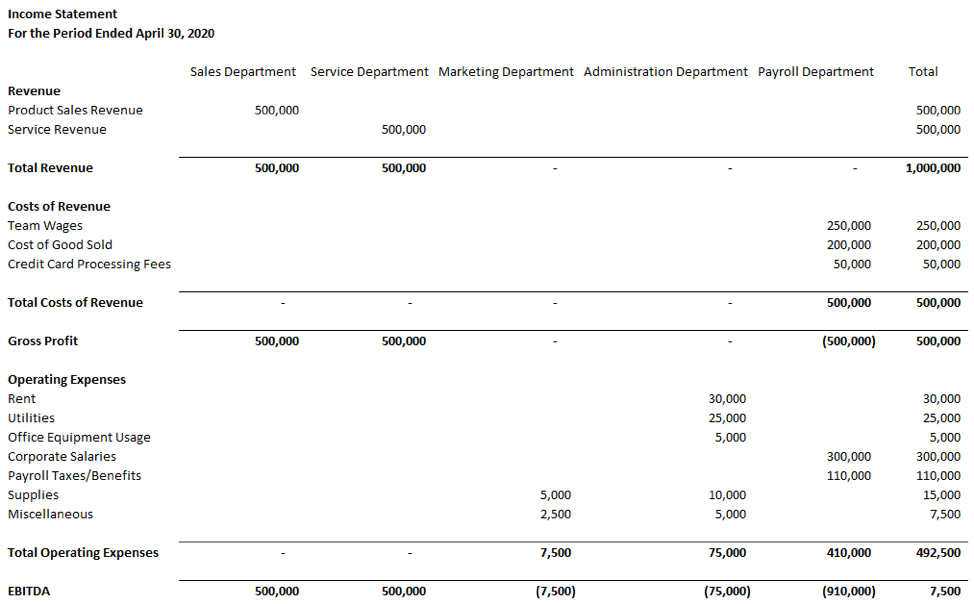
What does this Income Statement do to help Department managers understand their performance? That’s a rhetorical question. It does nothing. No costs sitting in the Marketing, Administration, and Payroll departments are being carried out of the kindness of the business owner’s heart. You incur those costs in the pursuit of revenue.
Imagine instead an Income Statement where you have analyzed the cost drivers and your shared costs are allocated. You can use allocations inside your accounting system to put costs in the right place and spread shared costs appropriately. You can see the before and after the impact of allocations right on the face of your statement. That looks something like this:
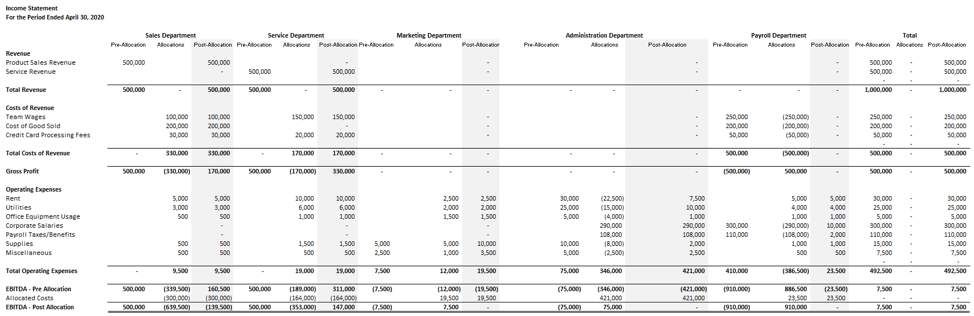
This is the value and importance of allocations. The first Income Statement gave zero indication that the Sales Department was taking up a disproportionate amount of shared resources. Now you have objective data in your hands. As a financial statement reader, you might look at this Income Statement and start to ask questions like “why is the Sales Department losing so much money” or “what can we do differently to improve this situation.” This changes the narrative.
The Magic of Sage Intacct Dynamic Allocations
So, how do you get this kind of quality insight without going through the pains of the 12-step process we saw outlined earlier? The answer is Sage Intacct Dynamic Allocations. This module is a native allocation solution that allows you to automate your allocation calculation tasks for routinely shifting costs or sharing revenues. You can automatically and dynamically generate allocations on a periodic basis. You build these allocations ONCE in Sage Intacct and run them as frequently as you like. If something changes (i.e. someone posts that pesky additional bill or journal entry), simply re-run the allocations to pick up the change. All the work you did last month is no longer useless because you are NOT repeating the extract data/build allocation/export financials process. Sage Intacct owns this process from end to end. The 12-step process above is almost entirely eliminated.
When you use Sage Intacct’s Dynamic Allocations, you get to define each component of your allocation. Defining this methodology is really quite simple. It’s broken out in the below graphic:
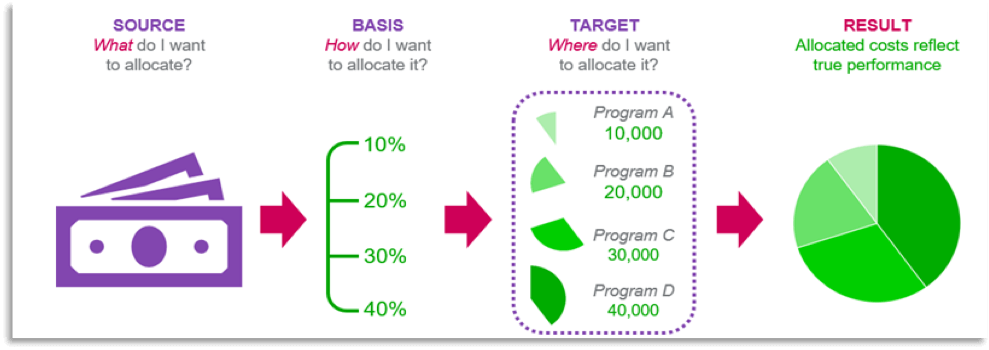
Once you define each portion (all through user-friendly drop-down menus, not through some complex code that requires IT’s help), you run the allocations as frequently as you want. You can group allocations together so they run in a defined order and respect any situations where one allocation is dependent on another allocation’s result.
Every allocation in Sage Intacct has impeccable drill-down capabilities so you can follow the trail of that allocation easily.
What are the benefits of this solution?
- Spend more time on oversight, analysis, and strategy
- Increase transparency and readiness for audits
- Understand the true performance of the business with data-driven decisions
- Save days of time
- Increase accuracy
- Gain insight of impacts to financials
Who benefits from this?
There’s a common misconception that this tool “primarily” benefits nonprofit organizations. That is wrong. Dynamic Allocations’ functionally has a universal benefit for any organization that has shared costs or revenues and needs to understand true financial performance. Some examples of this are:
- Any organization looking to allocate payroll or benefit costs
- Project-based organizations that have corporate team members, office space, etc. and need to understand the projects’ consumption of those resources for true profitability
- Contractors who need to calculate and bill for indirect costs
- Nonprofit organizations evaluating their programs’ ability to contribute to administration costs
- Service businesses with common costs shared across multiple departments
Dean Dorton has experienced resounding success stories with clients on Dynamic Allocations. For example, one organization transitioned from their legacy system’s process of generating and cleaning up over 40 allocations manually (a half-day or more affair) to a one-click allocation run process with Sage Intacct’s Dynamic Allocations. The power and flexibility of this module allow for creative use cases to solve not only those “generic” allocation needs, but also to handle automation in areas like reclassifying entries, nonprofit revenue release from restriction, and more. Register for our upcoming webinars for more information!
Dynamic Allocations: Optimize the True Performance of Your BusinessDynamic Allocations for Current Sage Intacct Users